Fixing the Spectrum Graph on F4HWN

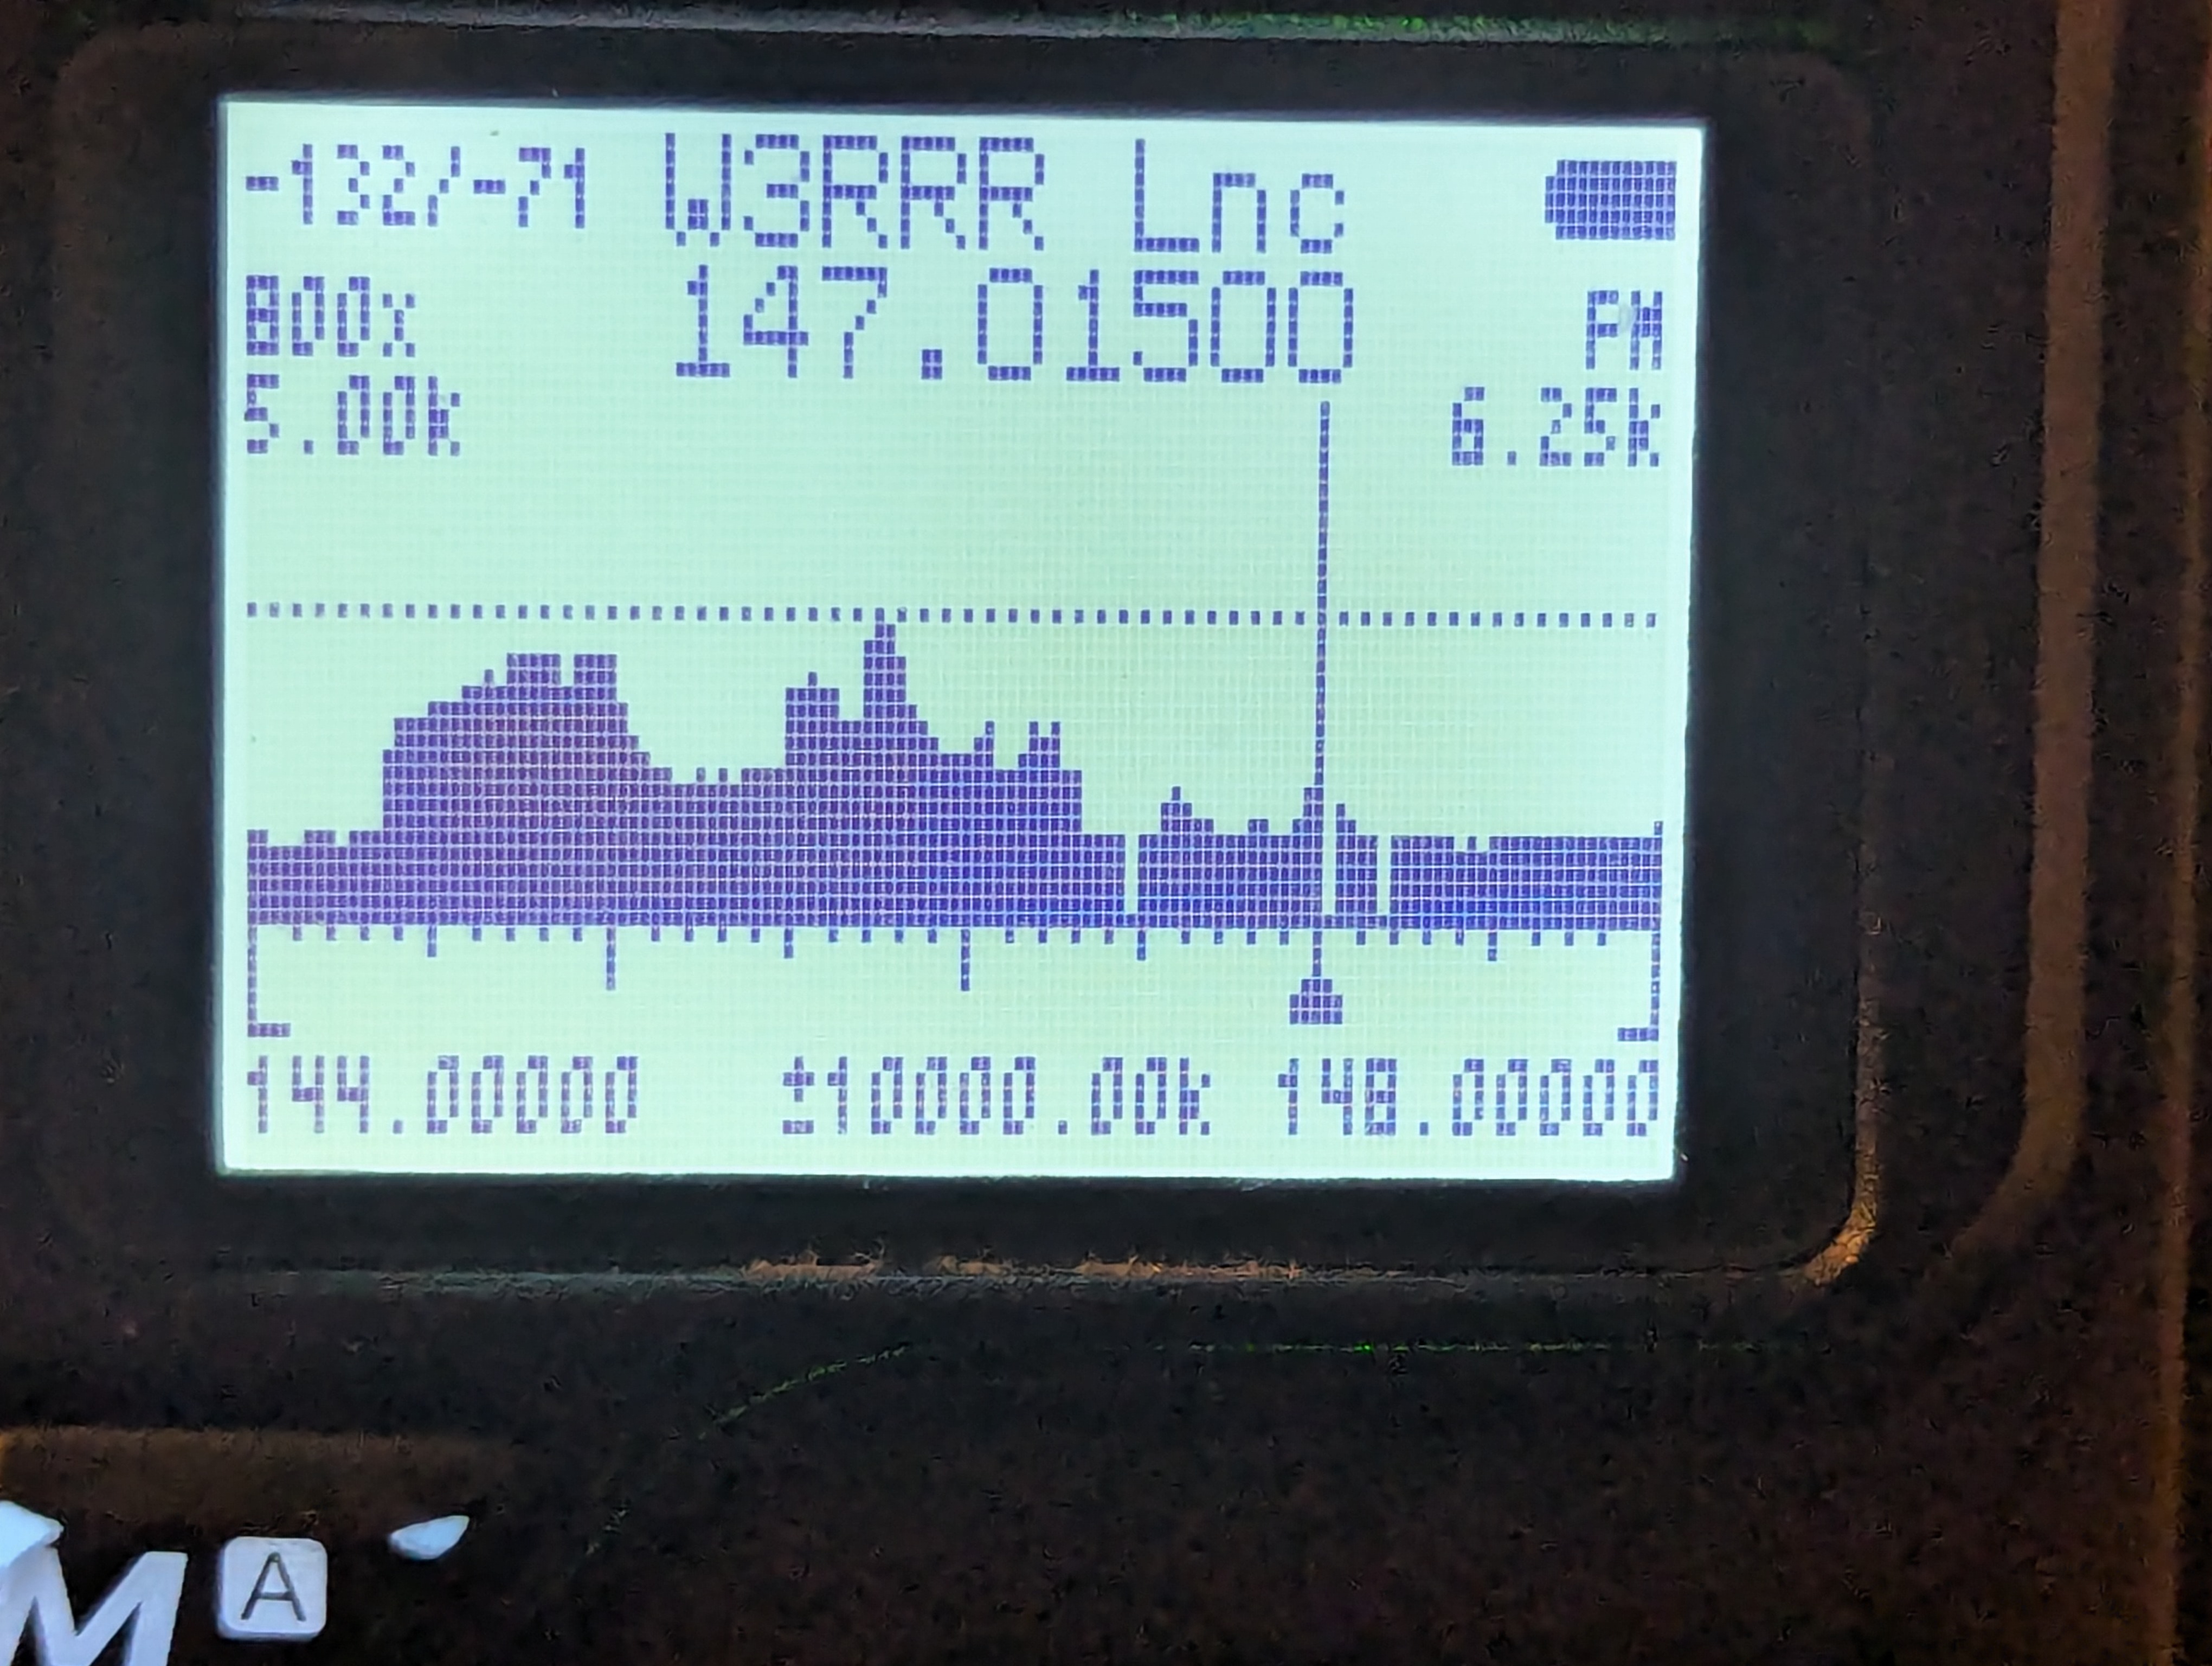
There was a bug for a while in F4HWN 3.9 on the Quansheng radios. The spectrum analyzer graph was too narrow when number of bars exceded 128. I’d easily run into the problem when I set the scan range to 144.000MHz to 148.000MHz, and activate the spectrum analyzer.

I dug into the code a bit and fixed it, so now it scales for large and small ranges.

I submitted a pull request to the project, and it was accepted and merged to be included in the F4HWN 4.0 release. Until that release, I’ll be running my custom build.

I also made a change to allow me to map the spectrum analyzer to a programmable side button like AubsUK had, but I’m no longer convinced it’s worth the limited code space it would consume in the binary.

Next Firmware: F4HWN

Problem: AUBSUK multiple scan list

The scan lists aren’t combining correctly on AUBSUK firmware. It’s skipping entries based on ordering. I realized I was missing most of simplex channels, but seeing the GMRS channels, when I enabled my “simplex” scan list in combo with primary repeaters. There’s an existing issue logged, but it’s hard to describe and to reproduce, I think.

Trying the Next Firmware, F4HWN 3.7

F4HWN is available on GitHub. I loaded it on both radios in place of AUBSUK to see how I get along. I’ve found a few features I really like:

  • Scan on start: if it’s scanning when I switch it off, it’ll scanning when switched on.
  • 3 scan lists: 1, 2, 3, 123, 0, all
    • they don’t recombine as freely, but I have:
      • simplex, repeaters, satellites on 1
      • GMRS on 3
  • scan is just as fast as others, so we’ll see if it’s tolerable.
  • “main only” display is nice, much easier to read.
  • spectrum analyzer with scan range, but I can’t assign it to a button.
    • Fn-5 is only way to activate it.

I think the S-meter is calibrated much differently from AUBSUK, and other firmwares I’ve loaded, calibration for VHF/UHF vs HF, The S-meter seems to read higher than I expect with lots of S9+.

The spectrum analyzer with a range seems wonky at times: it may be scanning the entire range, but the graph doesn’t seem all there. I noticed it with the scan of 144MHz-148MHz.

F4HWN 3.3

I loaded F4HWN 3.3 onto my UV-K5 to have a look. It only has 3 scan lists, and it’s awkward to cycle through them. I found starting the spectrum analyzer to be cumbersome as well, since i couldn’t attach it to a long-press of a button. The single VFO view is pretty nice; it puts lots of nice info on the screen, and it’s big. Ultimately, I went right back to AubsUK for the scan features.